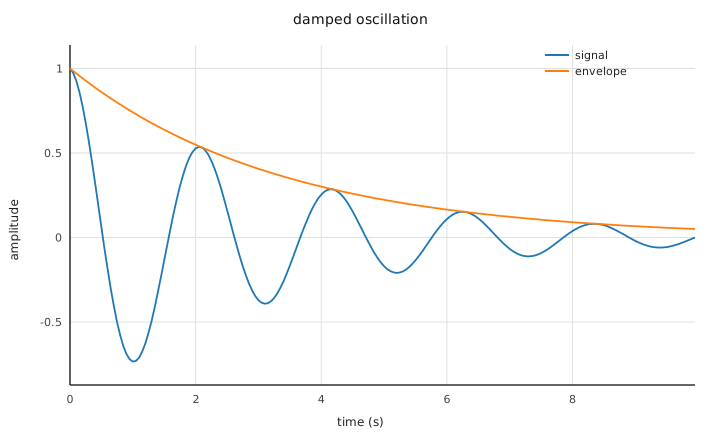
The end of most analyses is a figure, and figures are where reproducibility quietly dies: a plotting daemon, a font cache, a library version, and yesterday's PNG differs from today's for no scientific reason. Plot renders SVG as a STRING — pure computation, deterministic to the byte: the same program produces the same figure, byte for byte, on any machine, and this page's own build verifies exactly that for the figure below. A figure you can cmp is a figure you can trust in CI.
MODULE C9Plot ;

(* Chapter 9.  From numbers to a figure: Plot renders SVG as a
   STRING -- deterministic bytes, which is why the repository can
   hold plots to byte-identity against a Modula-2 oracle.  Here: a
   damped oscillation and its envelope, two labelled series, one
   file, no plotting daemon anywhere.

   Plot is the corpus' one STATEFUL module: AddLine accumulates
   into a module-level figure, which is why the definition says
   STATEFUL and a thread may not touch it while another draws.      *)

IMPORT Io ;
IMPORT Math ;
IMPORT Plot ;

CONST
  N = 200 ;

VAR
  pool   : POOL ;
  xs     : ARRAY 200 OF F64 ;
  ys, es : ARRAY 200 OF F64 ;
  i      : I64 ;
  t      : F64 ;
  svg    : STR ;

BEGIN
  FOR i := 0 TO N - 1 DO
    t := F64 (i) * 0.05 ;
    xs [i] := t ;
    es [i] := Math.Exp (0.0 - 0.3 * t) ;
    ys [i] := es [i] * Math.Cos (3.0 * t)
  END ;
  Plot.ClearFigure () ;
  Plot.AddLine (xs, ys, 0, 'signal') ;
  Plot.AddLine (xs, es, 1, 'envelope') ;
  svg := Plot.Render ('damped oscillation', 'time (s)', 'amplitude') ;
  Io.WriteFile ('/tmp/damped.svg', svg) ;
  Io.Write ('wrote /tmp/damped.svg, ') ;
  Io.WriteI64 (LEN (svg)) ;
  Io.WriteLine (' bytes')
EXCEPT
| ValueRange :
    Io.ErrLine ('rendering failed') ; Io.Halt (1)
| Overflow :
    Io.ErrLine ('overflow in the series') ; Io.Halt (1)
| Io.IOError :
    Io.ErrLine ('cannot write /tmp/damped.svg') ; Io.Halt (1)
END C9Plot.
C9Plot.m9
expected output:
wrote /tmp/damped.svg, 7847 bytes
The API is the smallest one that earns its keep: ClearFigure, AddLine (xs, ys, colorIndex, label) up to four labelled series, Render (title, xlabel, ylabel) — axes scaled and ticked with the same "nice step" rule everywhere, NaN points simply breaking the line (a gap in the data is a gap in the plot, per chapter 5). RenderHeat does the same for a matrix. The result is a string because chapter 5 already gave us the file boundary: Io.WriteFile, one checked call.
Run here, the figure appears as a link under the output — the sandbox keeps what a cell writes to its /tmp and serves it back. Run locally, open /tmp/damped.svg in any browser. Either way there is no step in which a plotting server, a GUI toolkit or a locale was consulted; the bytes are the bytes.
Where you are now
Eight programs ago the language was a stranger. What you have seen: programs whose imports, widths, failure modes, ownership and thread discipline are all in the source and all checked; a CSV reader that believes the file's documentation instead of guessing; statistics with scipy behind every digit; timeseries whose resolution and convention are data; a chunked-store reader whose use-after-close is uncompilable; and figures that diff. None of it was convenient to write. All of it is convenient to REVIEW — and review, not writing, is where scientific software spends its life.
The reference for every module these chapters used is generated from the definitions themselves (m9c --doc) and ships with the compiler: DynStr, Io, Fmt, Time, Csv, Stats, Mat, Math, Frame, ZarrStore, NetCDF, Parquet, Plot and the rest. The repository's museum/ directory is the language's design rationale in executable form. And every example you just read runs, verbatim, on every commit — if this page and the compiler ever disagree, the build breaks before you can read the lie.
 Scientific programming in Modula-9 — first steps